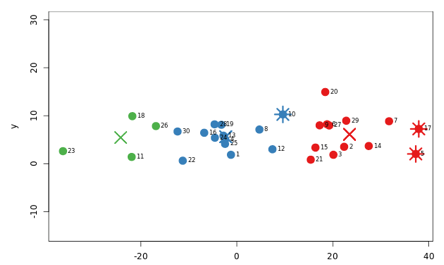
An interactive app showing the operation of various outlier and anomaly detection algorithms.
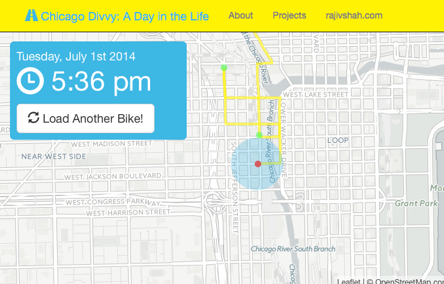
Divvy Bikes
A dynamic visualization on how Divvy bikes are used in Chicago with javascript animation.
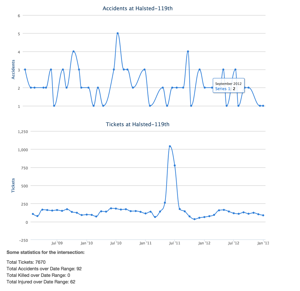
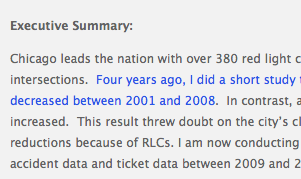
Red Light Cameras
Explore the data
GO
Read the study
Find dangerous roads
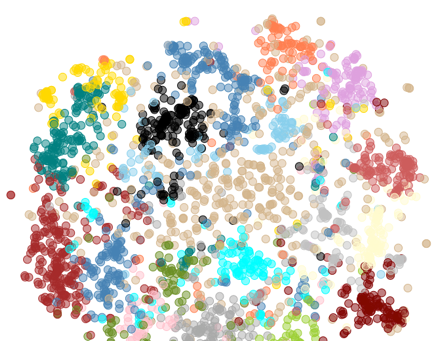
Text Analysis
This page presents a clustering example of 40,000 cases from the Seventh Circuit Court of Appeals. It uses Word2Vec with Kmeans for the clustering analysis. The results are then presented using Bokeh.
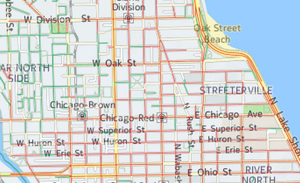
A short analysis and visualization
on how Chicago fixed 250,000 potholes in the last few years. Includes some simple descriptive statistics and an animation using torque for rendering time series spatial analysis.
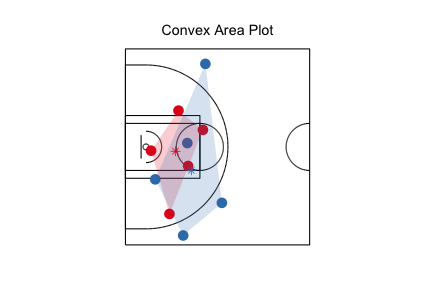
SportVu
Using NBA SportVU data for the analysis of basketball.


 >
>