Introduction
I was recently trying various outlier detection algorithms. For me, the best way to understand an algorithm is to tinker with it. I wanted to share my recent work on a shiny app that allows you to play around with various outlier algorithms.
The shiny app is available on my site, but even better, the code is on github for you to run locally or improve! I also posted a video that provides background on the app. Let me give you a quick tour of the app:
Algorithms
The available algorithms include:
- Hierarchical Clustering (DMwR)
- Kmeans (distance metrics from proxy)
- Kmeans Euclidean Distance
- Kmeans Mahalanobis
- Kmeans Manhattan
- Fuzzy kmeans (all from fclust)
- Fuzzy kmeans - Gustafson and Kessel
- Fuzzy k-medoids
- Fuzzy k-means with polynomial fuzzifier
- Local Outlier Factor (dbscan)
- RandomForest (proximity from randomForest)
- Isolation Forest (IsolationForest)
- Autoencoder (Autoencoder)
- FBOD and SOD (HighDimOut)
Datasets
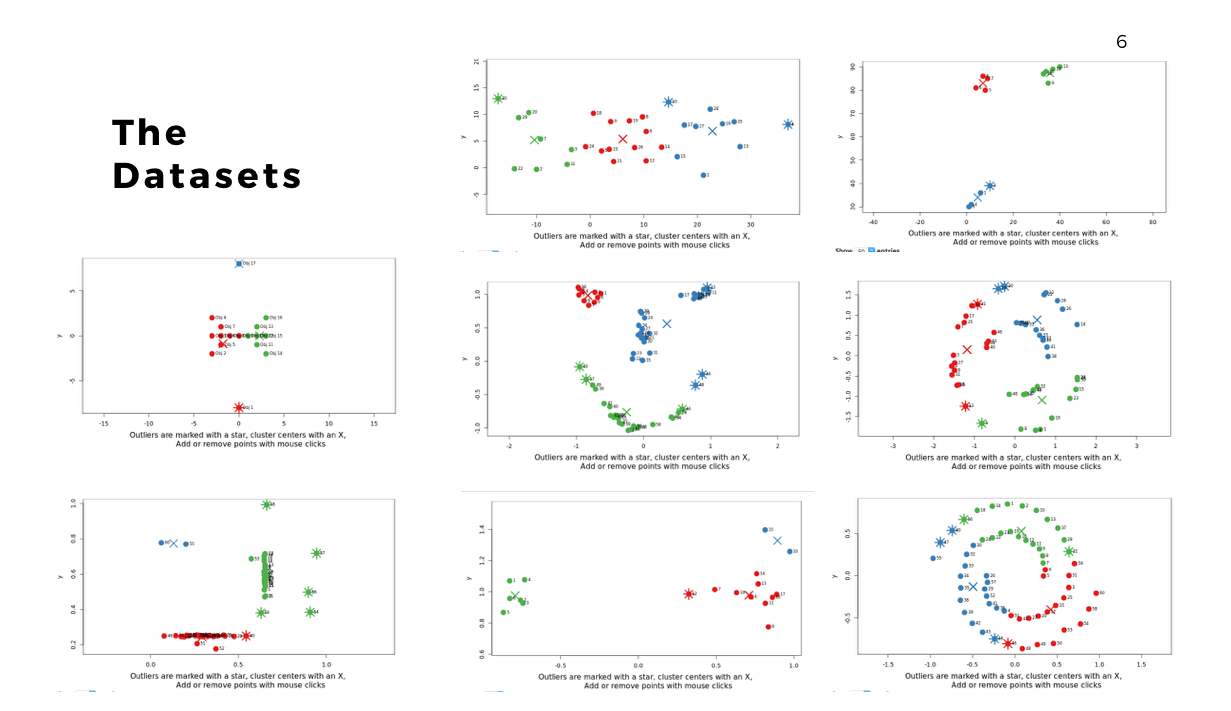
There are also a wide range of datasets to try as well:
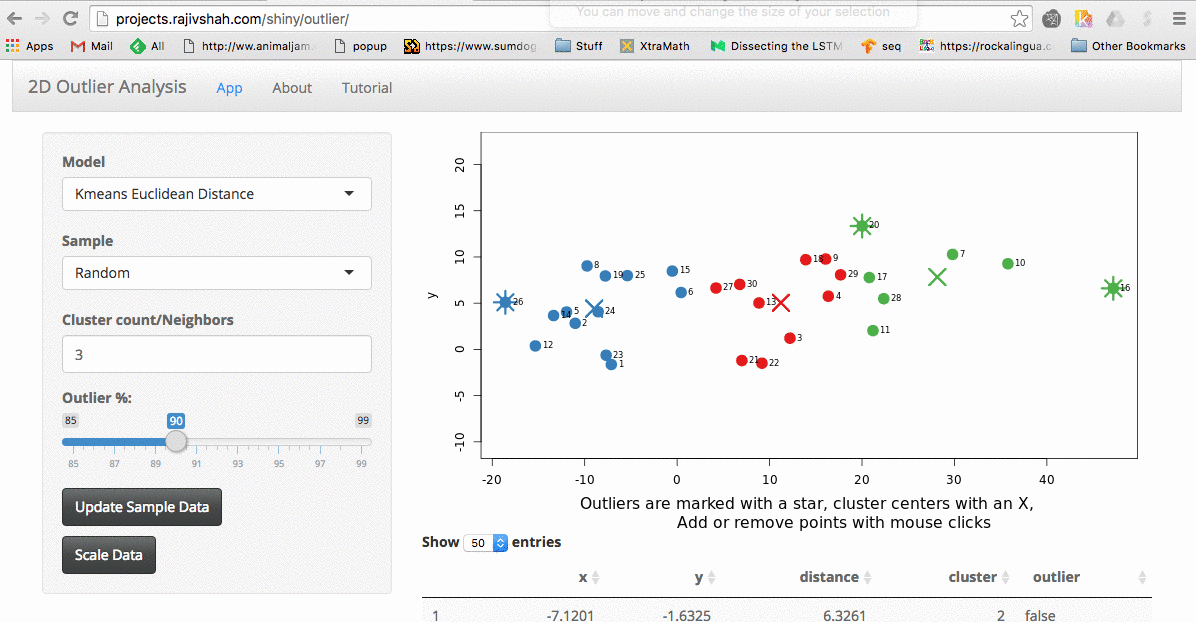
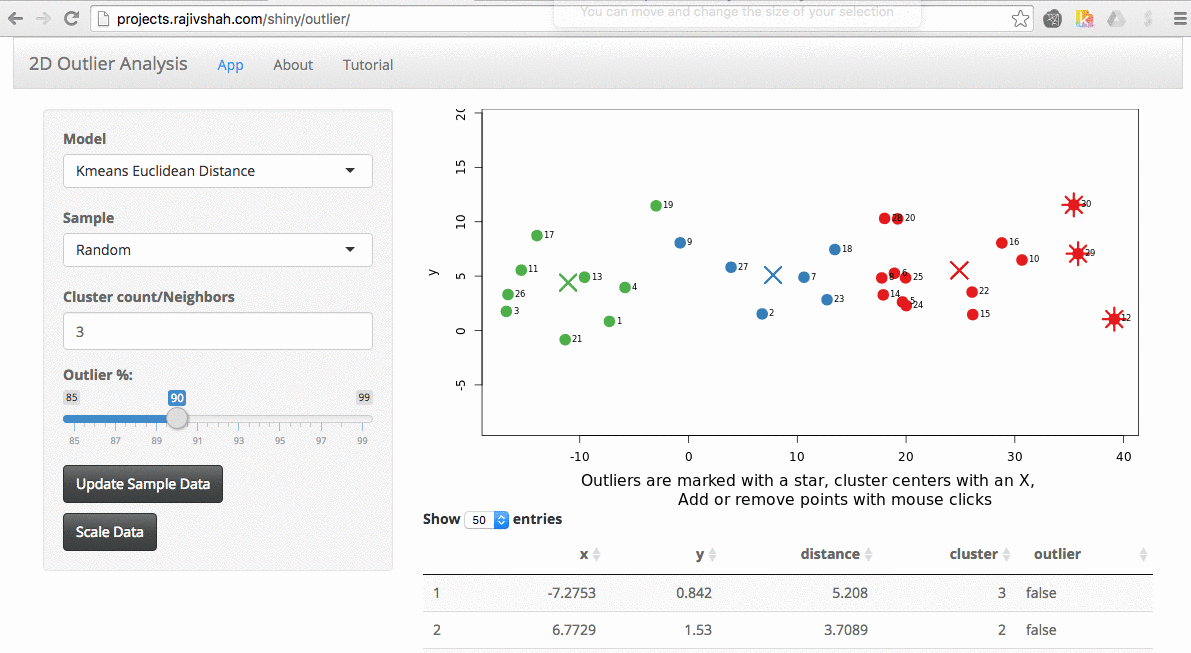
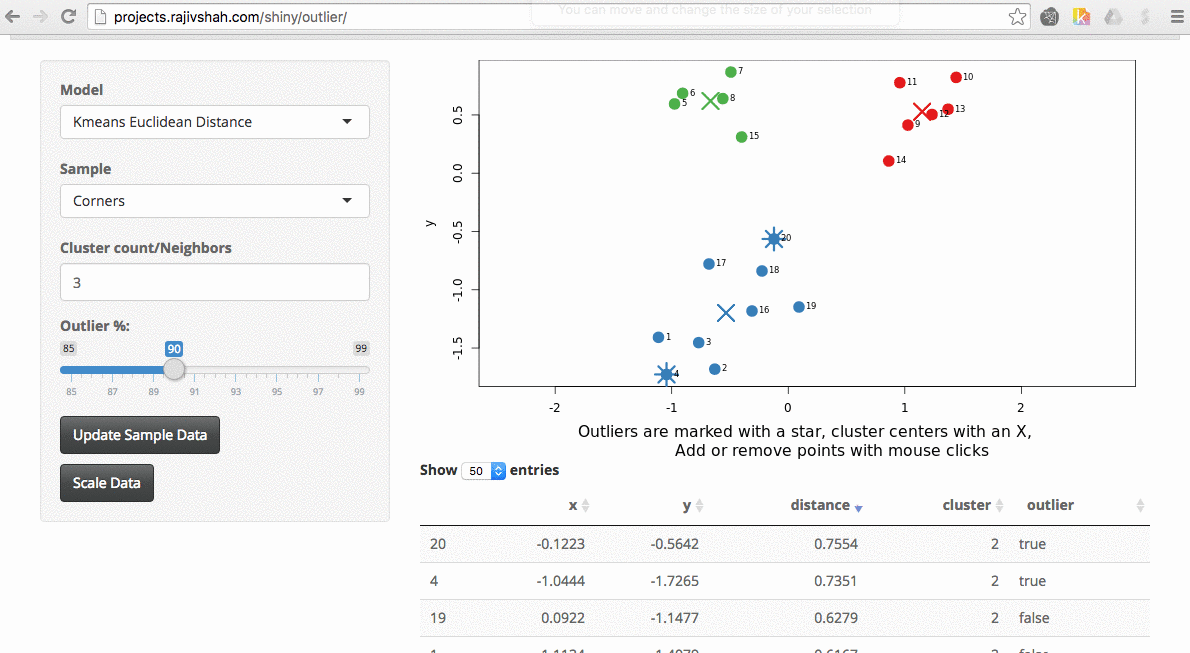
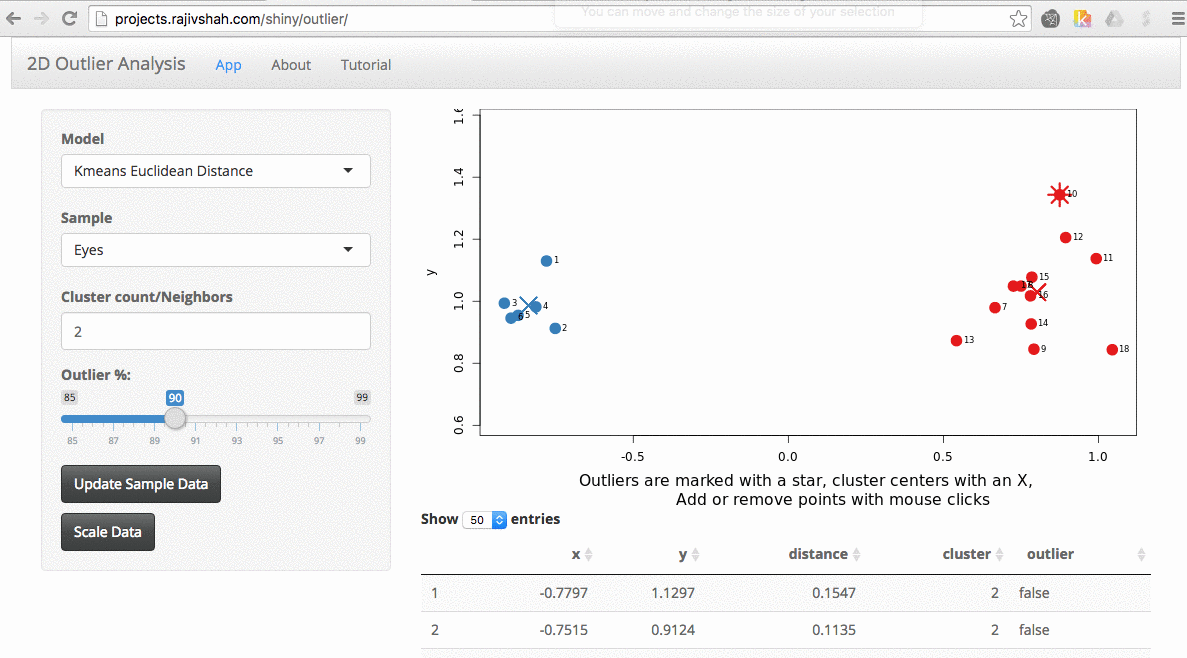
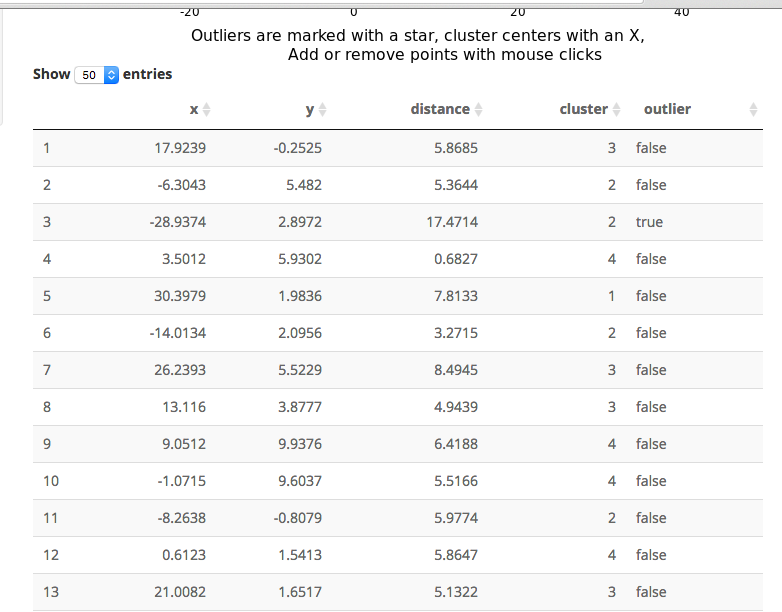
Once the data is loaded, you can start exploring. One thing you can do is look at the effect scaling can have. In this example, you can see how outliers differ when scaling is used. The values on the far right no longer dominate the distance measurements, and there are now outliers from other areas:
By trying different algorithms, you can see how different algorithms will select outliers. In this case, you see a difference between the outliers selected using an autoencoder versus isolation forest.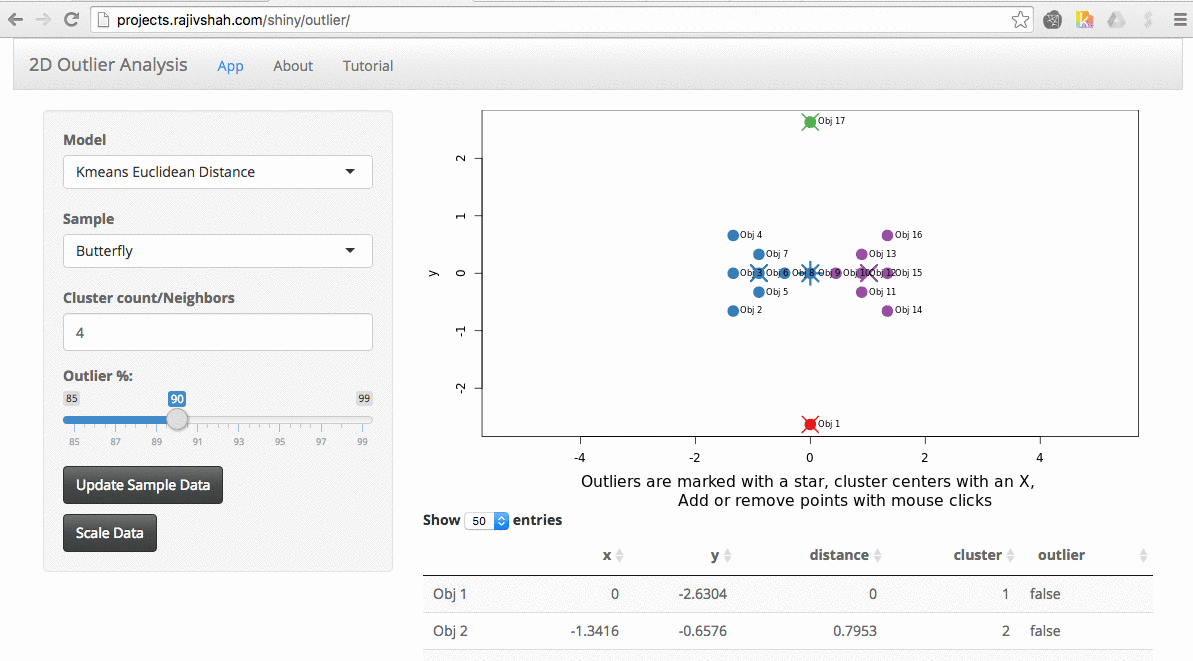
Another example here is the difference between kmeans and fuzzy kmeans as show below:
A density based algorithm can also select different outliers versus a distance based algorithm. This example nicely shows the difference between kmeans and lof (local outlier factor from dbscan)
An important part of using this visualization is studying the distance numbers that are calculated. Are these numbers meshing with your intuition? How big of a quantitative difference is there between outliers and other points?
So that is the 2D app. Please send me bug fixes, additional algorithms, or tighter code!
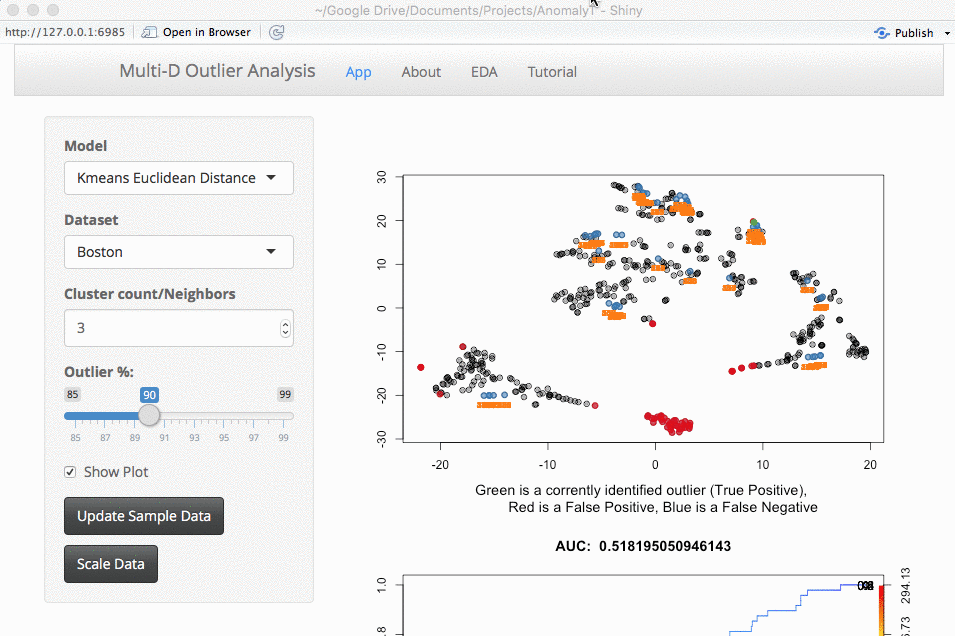
3D+ App?
The next thing is whether to expand this to larger datasets. This is something that you would run locally (large datasets take too long to run for my shiny server). The downside of larger datasets is that it gets tricker to visualize them. For now, I am using a TSNE plot. I am open to suggestions, but the intent here is a way to evaluate outlier algorithms on a variety of datasets.